Matthew Pennington
15
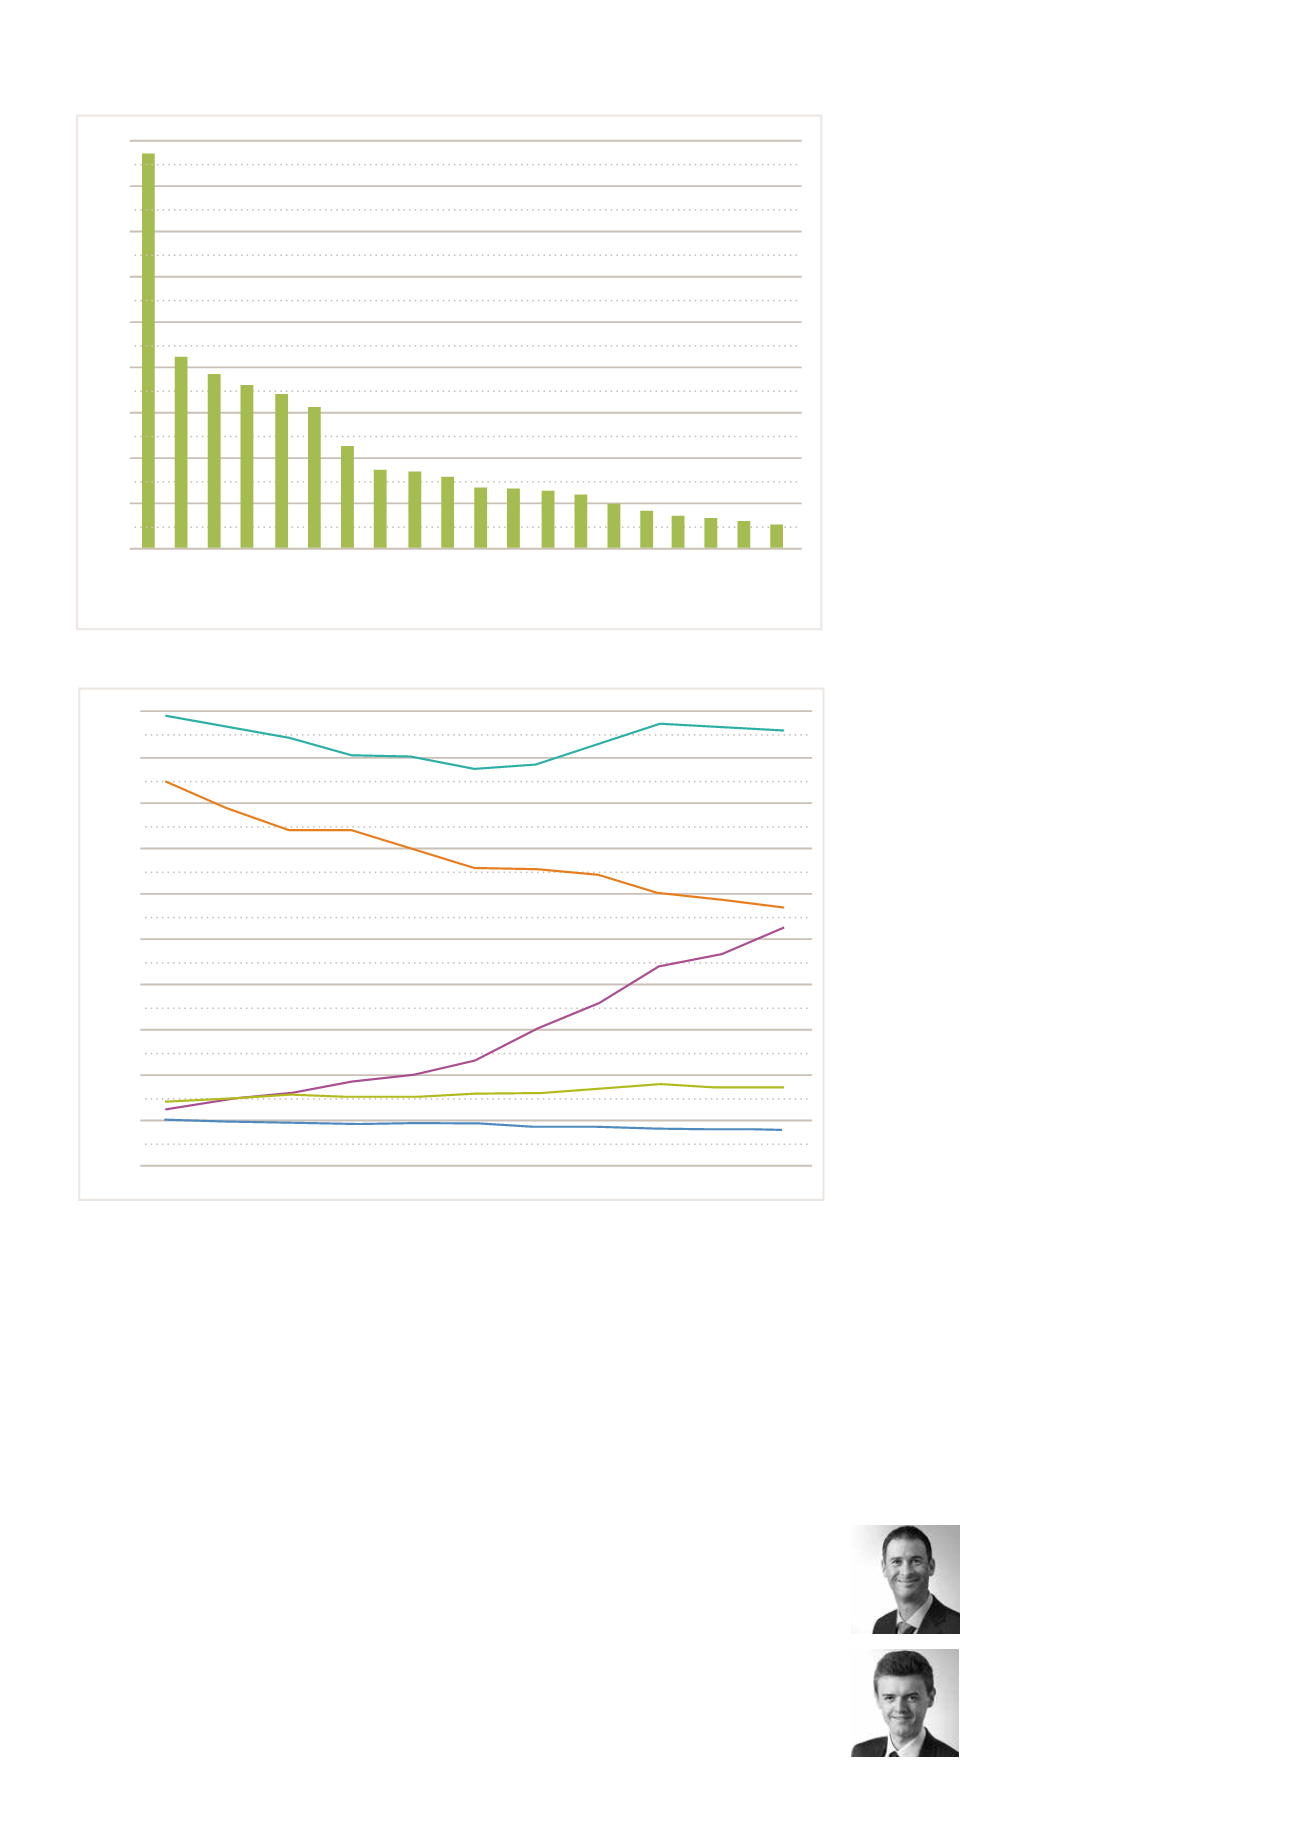
Additional data, provided by the World
Intellectual Property Organisation
(WIPO)
2
, shows resident patent filings
per £100bn GDP for the last 10 years
- see the graph above. The UK is at the
bottom of the pile, flat-lining at only
about one filing per £100m GDP. In
2015, the USA beat the UK by a factor
of about two and Korea beat the UK by
a factor of over ten.
These graphs show slightly different
things. One shows European patent
filings, the other shows resident
patent filings (i.e. filing in a resident’s
“home” patent office). However they
both make the same point loud and
clear - UK companies file significantly
fewer patent applications, in relative
terms, than their competitors in other
countries.
What is less clear is why the numbers
are so low. Broadly speaking, there are
two possible explanations.
One is that the UK really is less inventive
than the rest of the world - as the EPO
graph would have you believe. We would
like to think that’s not true - the UK is
renowned in the world of innovation, with
UK inventors famously having invented
the telephone, the world wide web, and
recently even the holographic television,
to name but a few.
A more plausible explanation is that
the UK has a different patent filing
“culture”, which originates from a
number of factors:
• There is a lower general awareness of
the value of patents
• Some UK tech companies attempt to
obtain competitive advantage in
other ways, for example by going to
market as quickly as possible or
relying on trade secrets
• Much of UK innovation originates
with smaller enterprises who are
either not aware of the value of
patents, or who find the costs
involved in obtaining patents
prohibitive (compare this with
Samsung and LG who account for
Korea’s top ranking)
• If they do file patents at all, UK
companies often file a single
all-encompassing “blockbuster”
application, compared with Japanese
or Korean companies which tend
to file a series of applications for
incremental improvements, creating
a so-called “patent thicket”
• Some UK innovation is in sectors not
traditionally associated with patents
- for instance computer games or
financial technology
Bear in mind that the UK’s anti-patent
culture is by no means universal - just
ask ARM Holdings. SoftBank’s £24bn
takeover was the biggest ever tech
deal in the UK, and the majority of
that value can be attributed to ARM’s
patent portfolio.
So the reasons are many and varied,
but the message to UK companies is
clear: your international competitors
are likely to be filing more patents than
you, and you need a strategy that takes
this into account. This might involve
filing more patent applications, or
simply becoming more aware of your
competitors’ patent portfolios.
To find out more contact
Jim Ribeiro
1
EPO Facts and figures 2016, page 15
2
Netherlands
Switzerland
Finland
Sweden
Denmark
Germany
Austria
Belgium
Japan
France
Israel
United States
Rep. of Korea
Ireland
Norway
UK
Singapore
Italy
Slovenia
300
0
400
600
700
800
900
European Patent Filings per Million Inhabitants in 2015
Chinese Taipei
200
500
100
Resident Patent Filings per £100 Billion GDP
3000
0
4000
6000
7000
8000
9000
2000
5000
1000
10000
2005 2006 2007 2008 2009 2010 2011 2012 2013 2014 2015
Republic of Korea
Japan
China
USA
United Kingdom


